Introduction
The ability to transform raw data into useful insights is critical in today's data-driven world. The secret to unlocking the potential in your data is data visualization. Amazon QuickSight is a cloud-based business intelligence (BI) service provided by Amazon Web Services (AWS) that specializes in data visualization. It enables organizations to create interactive dashboards, analyze data, and generate insights through visualizations. QuickSight is designed to be scalable, user-friendly, and cost-effective, making it suitable for businesses of all sizes.
In this blog, we’ll explore the powerful integration of Amazon QuickSight and Amazon S3, showcasing how this dynamic pair can transform your data into impactful insights and compelling visualizations.
Prerequisites
Have an AWS account. If you don’t have one, sign up here free and enjoy the benefit of 12 month free tier account.
Download the datasets from Kaggle. In this demo, I use Netflix dataset from Kaggle and other manifest is used to define the data source and data import configuration in Quick sight.
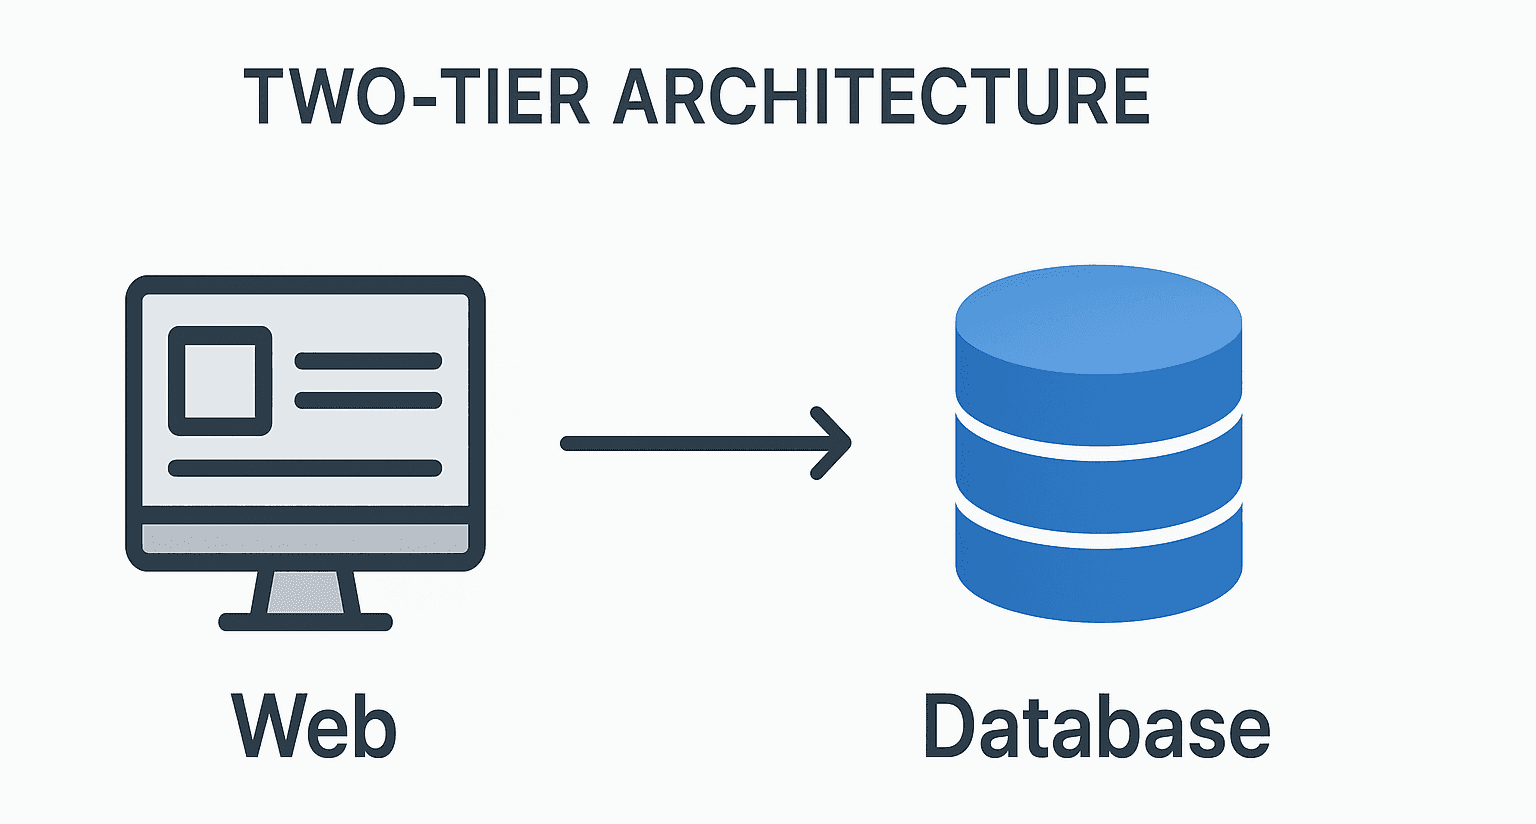
High-Level Architecture

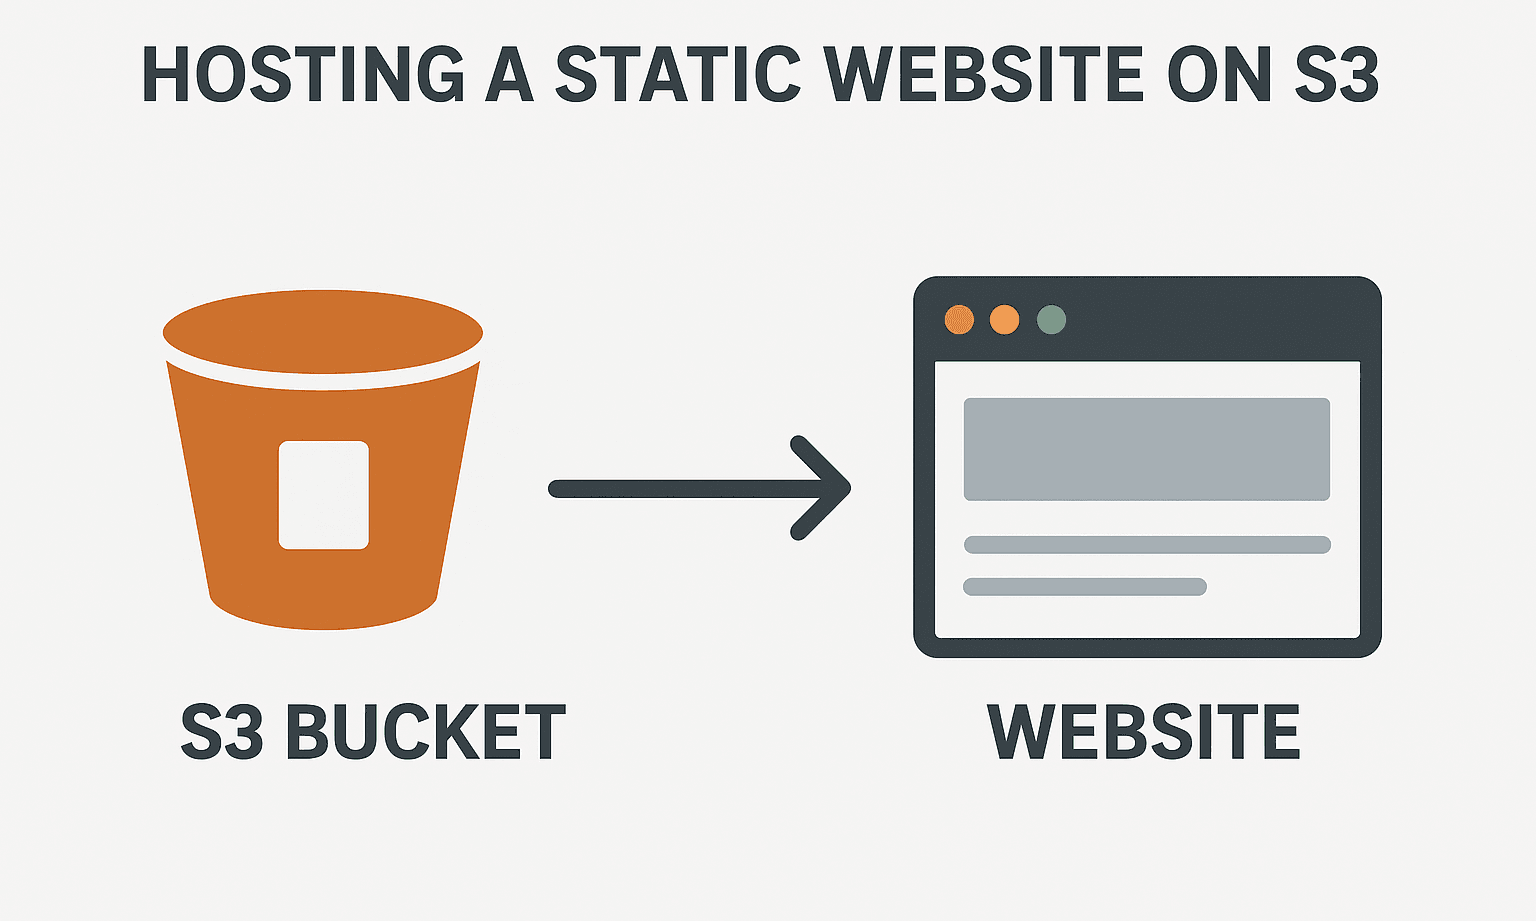
Store the Dataset in S3 Bucket
Open AWS management Console and search S3.
Click on the Create Bucket.
Give the bucket name unique , leave all the default setting as it is and click on the create bucket.
Click on the bucket that looks like this:

Upload the dataset that we downloaded Earlier.

Now, we have created a bucket which contains our netflix.csv and manifest.json file and copy the netflix_titles.csv URI.

Open manifest.json file and change the file location URI with your S3 URI which is copied earlier and re-upload the manifest.json file in your s3 bucket.

Create Amazon Quicksight Account
Search for Amazon QuickSight in AWS management Console.
Select Sign up for QuickSight.

- Enter the email address, scroll down, and select the Amazon S3 bucket. Then, click on the bucket that was created previously. Lastly, Don’t forgot to untick the Add Pixel-Perfect Reports.


- Finally, Our Amazon QuickSight account has been created. Let’s play around it.
Connect S3 bucket to Amazon QuickSight
From the left hand navigation bar, select Datasets, then New dataset.
Select S3.
For the first field (data source name), enter netflix-data.
Ooo there's also a second field called manifest.json URL - does manifest.json found familiar?
Open a new tab to open your AWS Management Console again. Head back to your S3 bucket.
Select the checkbox next to manifest.json, then select Copy S3 URI.

- Enter the S3 URI to our manifest.json file.

- Select Visualize and Interactive sheet to start creating visualizations.
Create Our First QuickSight Visualisation
Now we get to the creative part! With QuickSight, you can sort, filter, and customize your data to create visualizations. You can also experiment with different types of graphs like bar charts, pie charts, line graphs, etc.
We can see on the left hand panel that the dataset's fields are already imported.

- There you can see a different types of charts to create a visualization. Drag release_year into the Y-Axis heading. Woo! Now you can see a breakdown on the year that these Netflix-featured TV shows and movies were released.

- Let's save this in a dashboard. Click on the frame surrounding our lovely donut chart, and click on the white boxes at the edges to resize it.

Now let's create a new visual, select + ADD under the Visuals heading on our middle navigation bar, and we'll see another blank frame pop out.
Drag the release_year label into the Y Axis heading.
Next, drag the type label into the Group/Color heading.

- Chart that shows the breakdown of TV shows/movies for each release year. Change the graph type to Horizontal stacked 100% bar chart.

Now, Let’s demonstrate the same thing on table format.

Finally, we can see our dashboard looks like this.

Double-click on the titles of all the charts you see in front of you, and the 'Edit Title' panel will pop up. You can give each chart a name which is clear and easy to understand.

Final step, On the top right hand corner, select Publish. This will make your dashboard public so you can share it with your team.
Conclusion
In this project, we explored the powerful capabilities of Amazon QuickSight to transform raw data into actionable insights through intuitive visualizations that enable better decision-making. Through this hands-on exploration of QuickSight, we demonstrated its potential to enhance data-driven decision-making within businesses by providing intuitive, real-time visual analytics. The flexibility, scalability, and cost-effectiveness of QuickSight make it a powerful tool for organizations looking to harness the value of their data.
Resources
Amazon S3: Amazon S3 - Cloud Object Storage - AWS
Amazon QuickSight: Business Intelligence Tools - Amazon QuickSight - AWS